LIMITED SPOTS
All plans are 30% OFF for the first month! with the code WELCOME303
LIMITED SPOTS
All plans are 30% OFF for the first month! with the code WELCOME303

LIMITED SPOTS
All plans are 30% OFF for the first month! with the code WELCOME303
You closed 14 deals last quarter. Your marketing team ran campaigns across five channels. Your sales reps worked the phones, sent sequences, booked demos.
Now answer this: which of those channels produced the deals? How much did each closed customer actually cost you to acquire? And where exactly did the other 200 leads go?
If you can't answer those questions with confidence, you're not alone. A 2025 Demand Gen Report found that only 21% of B2B marketers can measure ROI with confidence. The rest are spending real money and hoping the pipeline math works out. It doesn't have to be that way. This guide walks you through building a lead-to-close pipeline with real dollar tracking at every stage, so you stop guessing and start making spending decisions based on evidence.
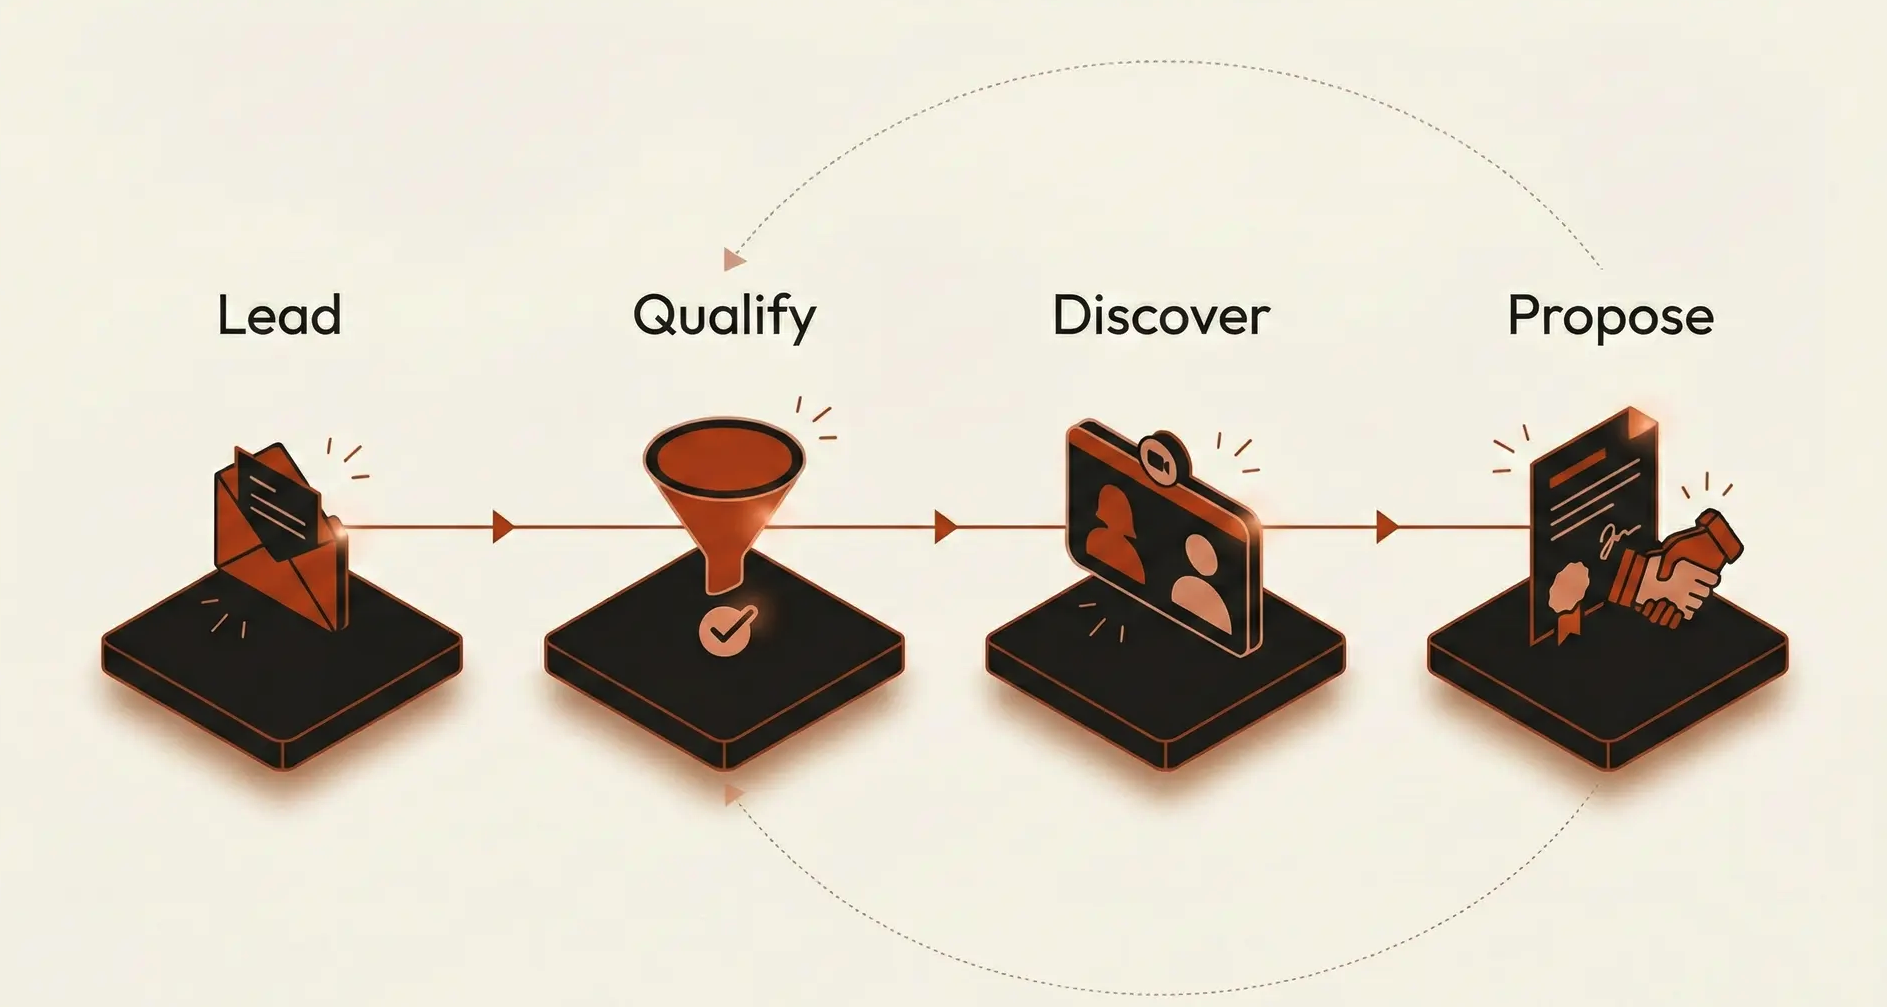
The typical sales pipeline looks clean on a whiteboard. Lead comes in, gets qualified, moves through discovery, receives a proposal, and closes. Simple enough.
The problem starts when you try to connect dollars to that journey.
Most teams track leads in one system, run ads from another, manage email sequences in a third, and log deals in a fourth. Salesforce data from 2025 shows that sellers use an average of eight tools to close deals. That's eight places where data lives, and almost none of them talk to each other by default.
Here's what happens in practice. Marketing spends $12,000 on a LinkedIn campaign. It generates 340 clicks and 47 form fills. Those leads land in a marketing automation tool. Some get passed to sales. A rep picks up 15 of them, books 6 demos, and closes 2 deals worth $38,000 combined. On the surface, that looks like a win. But nobody can tell you which of those 2 closed deals actually came from LinkedIn versus organic search versus a referral that happened to click the ad. The attribution is broken before the lead even hits the pipeline.
Gartner research backs this up: bad data costs companies an average of $12.9 million per year. That figure includes missed opportunities, duplicated efforts, and marketing spend that can't be traced to outcomes. For smaller teams, the proportional damage is even worse because every dollar matters more.
The root cause isn't laziness or incompetence. It's architecture. When your lead capture, nurturing, sales tracking, and revenue reporting live in disconnected systems, you physically can't follow a dollar from ad spend to closed deal without manual stitching. And manual stitching doesn't scale.
Before worrying about dashboards and attribution models, you need to solve the plumbing problem. Every tool in your sales and marketing stack needs to feed into (or pull from) a single source of truth.
This is where most teams underinvest. They buy a CRM, bolt on a marketing tool, add an invoicing system, and assume the integrations will handle themselves. They won't.
An integrated platform approach works better. ERP-backed systems like Odoo, for example, connect sales, marketing, invoicing, and inventory in a single database. For teams that don't have the internal expertise to configure this properly, working with Odoo consulting services can cut months off the implementation timeline and prevent the costly mistakes that come from misconfigured workflows. The point isn't which specific platform you pick; it's that your pipeline data flows end-to-end without manual handoffs between systems.
When evaluating your integration architecture, focus on these five connection points:
Lead capture to CRM. Every form, chatbot, and inbound call needs to create a record in your CRM with the original source tagged automatically. No manual entry, no "I'll update it later."
CRM to marketing automation. When a rep updates a deal stge, your marketing system should know. This prevents sending nurture emails to someone who's already in a sales conversation.
CRM to finance. When a deal closes, the revenue should flow directly to your accounting records with the full attribution chain intact. If your sales system and your invoicing system don't share data, you lose the thread.
Ad platforms to CRM. UTM parameters and click IDs from Google Ads, LinkedIn, and Meta need to follow the lead all the way through the funnel. If the tracking stops at the form fill, you can't attribute revenue to ad spend.
Customer support to sales. Post-sale interactions affect lifetime value calculations. If your support tickets live in a separate system, your cost-per-acquisition numbers will be incomplete.
The companies that track spend effectively aren't necessarily using the most expensive tools. They're using connected tools. According to Salesforce's 2025 State of Sales research, 84% of sales teams without an all-in-one platform plan to consolidate their technology. The consolidation trend isn't about simplicity for its own sake; it's about making dollar tracking possible.
A pipeline stage isn't useful for spend tracking unless it has a clear entry criteria, an exit criteria, and a cost associated with crossing that threshold.
Most teams define stages loosely. "Qualified" might mean different things to different reps. "Proposal sent" doesn't tell you whether the prospect actually engaged with it. Loose definitions create loose data, and loose data makes dollar tracking impossible.
Here's a framework that ties each stage to actual costs:
Lead captured (Cost: acquisition cost per lead). This is your ad spend, content production cost, and event sponsorship divided by the number of leads generated. If you spent $8,000 on content marketing and generated 200 leads, each lead entering this stage costs you $40.
Marketing qualified (Cost: nurturing cost per MQL). Add the cost of your email platform, marketing automation tools, and the team hours spent on nurture campaigns. Divide by MQLs produced. This tells you what it costs to move a raw lead to "sales-ready."
Sales accepted (Cost: sales time investment). Calculate your average rep's fully loaded hourly cost. Multiply by the average hours spent on discovery calls, research, and initial outreach per prospect. If a rep costs $75/hour fully loaded and spends 3 hours per prospect before accepting or rejecting them, that stage costs $225 per lead.
Proposal delivered (Cost: solution engineering plus materials). Include demo preparation time, custom proposal creation, and any technical resources involved. For B2B teams, this is often the most expensive stage on a per-lead basis.
While this is traditionally the most expensive stage, platforms like ClientPoint automate custom proposal creation and provide engagement analytics. This significantly lowers the 'cost-per-proposal' while giving sales leaders visibility into why deals stall at this exact moment.
Closed won (Cost: total accumulated spend). Roll up every cost from every prior stage. This is your true customer acquisition cost, and it should be calculated automatically by your system, not by someone pulling numbers from four different spreadsheets.
The goal isn't precision to the penny. It's directional accuracy that lets you compare channels, campaigns, and time periods. When you know that leads from Google Ads cost $60 each at capture but $1,200 each at close, while referral leads cost $0 at capture and $400 at close, you can make real decisions about where to allocate budget.
Attribution is where most spend-tracking pipelines fall apart. First-touch attribution gives all the credit to the initial ad click. Last-touch gives it all to the final interaction before the sale. Both are wrong, and both lead to bad spending decisions.
Multi-touch attribution isn't perfect either, but it's far closer to reality. The challenge is implementing it without drowning in complexity.
For teams under 50 people, here's a practical approach that works. Tag every lead with a primary source at capture, such as paid search, organic, referral, event, or outbound. Then track every meaningful interaction after that: emails opened, pages visited, calls completed, demos attended. When the deal closes, distribute the revenue credit across touchpoints using a simple weighted model.
A common weighting that balances simplicity with accuracy:
First touch gets 30% of the credit (it started the relationship)
Lead conversion point gets 30% (the moment they became a known contact)
Opportunity creation gets 30% (when sales accepted the deal)
Remaining touchpoints split the last 10%
This isn't as sophisticated as algorithmic attribution, but it solves the biggest problem: it stops you from over-investing in one channel because it happened to be first or last in the chain.
CRM data supports this approach. According to Nucleus Research, the average CRM returns $8.71 for every dollar invested. But that ROI only materializes when the system is configured to track these touchpoints consistently. A CRM that's used as a glorified address book won't give you attribution data. One that's set up to log every interaction, tag every source, and calculate stage-by-stage costs will.
Forrester research shows that sales teams with proper CRM implementation can see lead conversion rate improvements of up to 300%. That number sounds aggressive, but it makes sense when you consider what changes: reps stop chasing dead leads because the data tells them which prospects are actually engaged, and marketing stops funding channels that produce low-conversion traffic.
A pipeline report that nobody reads is worse than no report at all, because it creates the illusion of accountability without the substance.
The most common reason pipeline reports go unread is that they require too much effort to interpret. A 47-column spreadsheet with raw data doesn't help a VP of Sales decide where to focus next week. A dashboard showing three numbers, cost per acquisition by channel, pipeline velocity by stage, and forecast accuracy versus actual, does.
Build your reporting around three questions that matter:
Where is money being wasted? Show cost per closed deal by channel and campaign. If your trade show leads cost 6x more per closed deal than your webinar leads, that's a conversation worth having.
Where are deals stalling? Track average time in each pipeline stage. If proposals sit for 3 weeks on average but discovery calls happen within 48 hours, your bottleneck is clear.
How accurate are our forecasts? Compare predicted close amounts to actual closed revenue each month. If your team consistently over-forecasts by 40%, your pipeline stages need tighter qualification criteria.
Automate these reports to hit inboxes weekly. According to CRM.org research, 82% of companies use their CRM for process automation and sales reporting. The ones getting real value aren't just automating the generation of reports. They're automating the delivery and making the data actionable by keeping it focused.
One tactic that works surprisingly well: include a single "recommended action" at the top of each automated report. Instead of just showing that Channel X has a high cost per acquisition, add a line that says "Consider reallocating 20% of Channel X budget to Channel Y, which shows 3x better conversion at the proposal stage." This turns passive reporting into active decision support.
Your pipeline isn't a set-it-and-forget-it system. Markets shift, buyer behavior changes, and your team evolves. The dollar-tracking infrastructure you build today will need recalibration every quarter.
Schedule a quarterly pipeline audit that covers three areas. First, check data hygiene. Are reps actually logging activities and tagging sources? HubSpot's 2024 State of Marketing Report found that 40% of salespeople still use informal methods like spreadsheets and email to store customer data. If your team is bypassing the CRM, your tracking is already broken. Second, review stage definitions. If 60% of your "qualified" leads never make it to proposal, your qualification criteria are too loose. Tighten them. Third, recalculate your stage costs. Salaries change, tool costs fluctuate, and channel pricing shifts. Your cost-per-stage numbers from six months ago might be 20% off today.
The companies that do this consistently tend to be the ones that can answer the question every CFO asks: "What did we get for that marketing spend?" They don't scramble to build a retrospective analysis. They pull up the dashboard and show the numbers in real time.
Building a lead-to-close pipeline with dollar tracking isn't complicated in theory. It requires connected systems, clearly defined stages with cost gates, multi-touch attribution, focused reporting, and regular maintenance. The hard part is doing the work to set it up properly. But once it's running, you stop debating where to spend money and start knowing. That's a competitive advantage most teams don't have yet.
 Send emails at scale