LIMITED SPOTS
All plans are 30% OFF for the first month! with the code WELCOME303
LIMITED SPOTS
All plans are 30% OFF for the first month! with the code WELCOME303

LIMITED SPOTS
All plans are 30% OFF for the first month! with the code WELCOME303
In today’s competitive, data-heavy business space, the old sales pipeline (once simple and fairly straight) has grown into a fast-moving system with many moving parts. To do well in this setup, companies need to use every helpful tool they have. This is where business intelligence (BI) comes in. BI turns large amounts of raw data into clear, useful insights. It’s no longer a “nice to have.”
BI now acts like a guide for sales teams, helping them make better decisions, improve their sales plans, and bring in more revenue. It replaces guesswork with facts, so teams can see what happened, why it happened, and what may happen next.
Many companies are surrounded by sales data, but they still don’t have a good way to use it. That’s common: too much information can feel like a problem instead of a benefit. Business intelligence systems are built to solve this. They provide tools and steps to collect, analyze, and explain data in a way that leads to real sales improvements. If your goal is to get more value from your data and stay ahead of competitors, checking out expert options like Addepto business intelligence can help a lot, especially if you want BI plans that fit your sales goals and day-to-day needs.
Business Intelligence (BI) in sales means using data tools and software to collect, combine, and analyze sales information. The main goal is to help sales teams make decisions based on data and improve how they work by turning hard-to-read sales data into simple reports, dashboards, and forecast models. BI covers the “what” (like revenue, lead volume, deal counts) and also explains the “why” and “how.” It helps teams understand customer behavior, market trends, and how well internal sales processes are working.
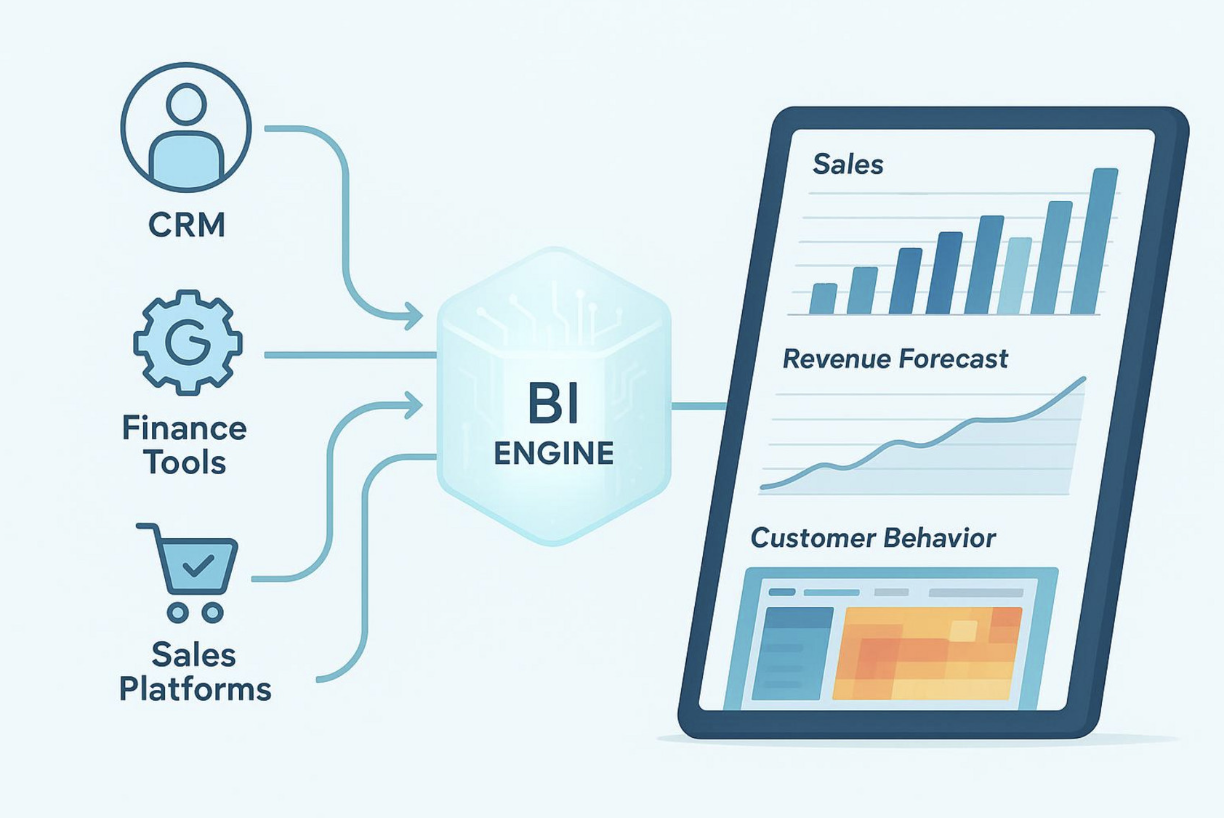
This shift matters because it helps sales teams plan ahead instead of only reacting after something goes wrong. Instead of only reviewing past sales numbers, BI helps teams explore what caused those results, such as customer traits, buying habits, or the impact of a sales campaign. By pulling data from different systems-like CRMs, sales platforms, and finance tools-BI creates one shared view that older, separated reports could not provide.
A strong BI system is not one single tool. It is a setup made of connected parts. Each part helps move data from “raw” to “ready to use,” so the insights are accurate, on time, and helpful.
Data pipelines move data through the BI setup. They pull data from different sources, clean and reshape it into a consistent format, and then load it into storage so it can be analyzed. This Extract, Transform, Load (ETL) flow matters because it makes sure the data is clean and trustworthy.
Pipelines also support near real-time reporting, which helps sales leaders act on current trends. Without solid pipelines, BI tools would quickly become outdated, which is a problem in sales where customer needs and market conditions can change quickly.
After data is processed, it is often stored in a data warehouse. This is a storage system built for analysis. It holds large amounts of structured data from many parts of the company. Unlike operational databases (built for daily transactions), data warehouses are built for queries and reporting.
For sales and marketing teams, data warehouses are very helpful because they keep a history of performance over time. Teams can review customer buying patterns, compare results across time periods, and check campaign impact. Setting up and running a warehouse may require people like database admins or DevOps staff, but having one central place for data can greatly improve decision-making.
Once the data is cleaned and stored, the next step is understanding it. Analytics tools-from Python and R to full analytics platforms-help teams study large datasets and find useful insights. These tools can help spot new opportunities, build revenue forecasts, and plan more accurately.
Visualization is how these insights are shown in a simple way. Dashboards, charts, graphs, and interactive reports help people see patterns that would be hard to catch in raw tables. This makes data easier to use for everyone, from sales reps to executives, by putting key performance indicators (KPIs) in front of them.
BI interfaces are what users actually see and click on: dashboards, reports, filters, and interactive views. While they are closely linked to visualization, the focus here is usability and interaction. A well-built interface helps people across teams use data more naturally, which supports a data-driven way of working.
For sales teams, this means real-time tracking of results, quick spotting of unusual changes, and faster action. For leaders, it means a clear view of company-wide KPIs. The goal is simple: give people easy access to insights so they can make smart decisions.
Adding business intelligence is more than a small upgrade. It changes how a modern sales pipeline runs. BI brings data into each stage of the pipeline, making sales work more efficient, more accurate, and more consistent.
One of the biggest effects of BI in sales is better forecasting. Teams no longer need to depend on gut feelings or basic spreadsheets. BI tools use past sales, current trends, customer location, buying history, and even outside market signals to predict future sales. They can account for seasonality, promotions, slow-moving products, and unusual events that might affect results.
Better forecasts help a company plan resources and set realistic targets. They also support pricing and promotion decisions and help guide product plans. Accurate forecasting also improves inventory planning by reducing stockouts (lost sales) and avoiding too much inventory (cash tied up). BI supports both big-picture changes and day-to-day shifts, helping teams adjust quickly.

In a modern pipeline, some leads are much more likely to buy than others. BI helps sales teams qualify leads better and improve conversion rates. By carefully reviewing past lead data, companies can find patterns, such as:
Which lead types convert most often
When prospects are most likely to respond
Which channels bring the highest-quality leads
This helps sales teams spend time where it matters most. Marketing can also use this data to bring in more leads that match the same high-converting profile, which raises overall conversion and improves return on sales and marketing spend.
Sales efficiency depends a lot on how resources are assigned. BI helps improve sales territories by analyzing customer location data in detail. Companies can adjust territories so sales reps and budgets focus on areas with the most potential, instead of spending time in low-value regions.
BI can also highlight groups that are not being targeted enough. This can point to new markets or show where marketing needs to focus more. With a clear view of customer distribution and demand, companies can shift resources to get better coverage and better results.
Strong pipeline management supports steady revenue. BI gives sales teams the ability to track each deal and stage in real time and spot slow points in the process. When BI connects with CRM tools like Salesforce, it can combine pipeline data with other sources for deeper analysis.
A sales dashboard can show pipeline status by salesperson and time period, helping managers predict results without manual work. It also helps explain why sales are rising in one area and falling in another. Tracking activity like leads, meetings, and closed deals-monthly, quarterly, and yearly-helps teams stay on track, find weak points, and spot extra revenue opportunities.
Customers expect companies to understand them. BI helps by analyzing customer data such as demographics, preferences, and purchase history. With this detail, sales teams can match customer needs more closely, leading to more personal conversations and a better customer experience.
By studying past sales, teams can find buying patterns and market trends. This supports long-term marketing planning and short-term changes. BI can also rank customers by how recent, how often, and how much they buy. This helps companies find their most profitable customers and build profiles to attract more people like them.
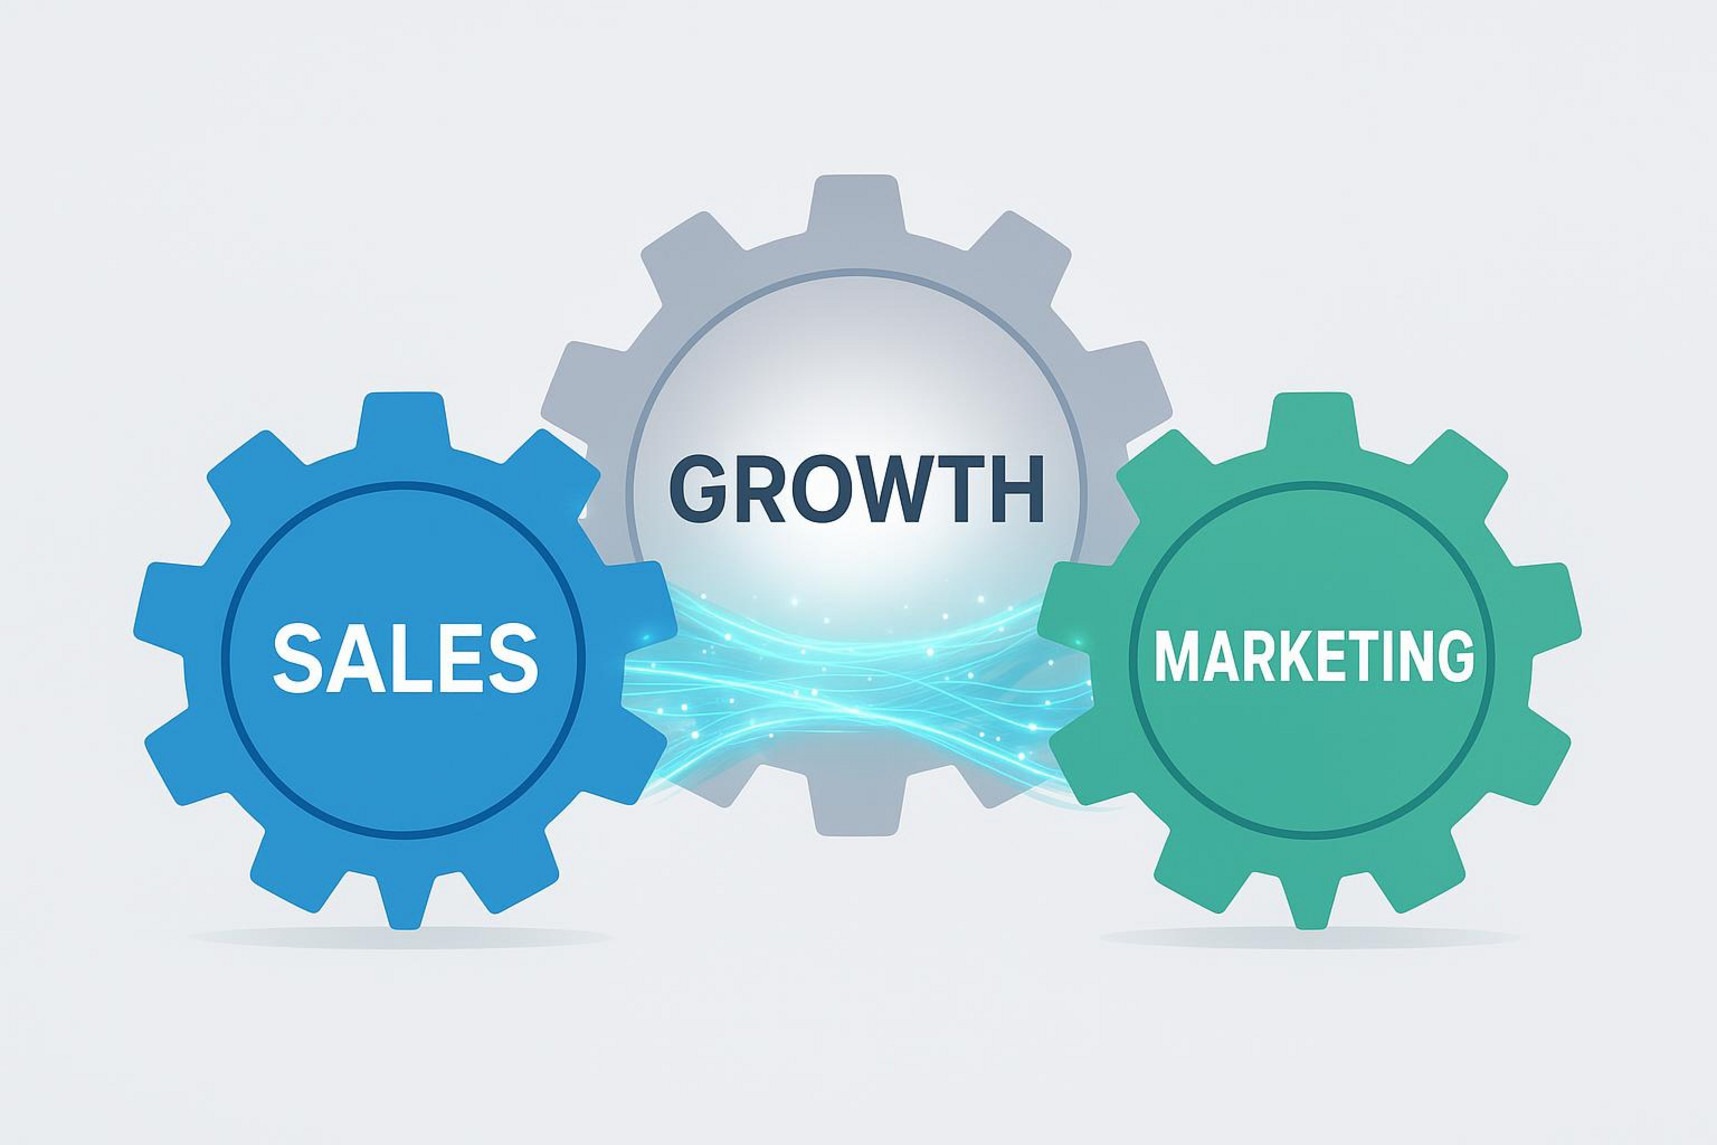
Sales and marketing alignment is often talked about, but it’s hard to fully achieve without shared data. BI helps connect both teams by removing data barriers and supporting shared decisions that help both the business and the customer.
Sales and marketing teams often track different metrics and may even aim for different outcomes. BI brings data from sales, marketing, and finance into one clear view, so both teams can work from the same facts.
When both teams share insights, common goals are easier to reach. For example, if marketing sees rising interest in a product feature and sales hears the same thing from customers, both teams can act quickly. Marketing can highlight the feature in campaigns, and sales can focus on it in calls. This shared direction improves campaign targeting (like focusing on the Ideal Customer Profile) and helps improve conversions and retention through consistent messaging.
BI can improve the customer experience by supporting more personal and timely interactions. When companies combine marketing and sales data, they get a full picture of the customer and can adjust messages and offers to better fit each person.
Knowing preferences also helps companies predict needs. They can suggest related products or offer support earlier, which strengthens relationships and loyalty. Shared insights also help sales and marketing stay consistent, so customers better understand the company and what it stands for.
Measuring the real impact of campaigns can be hard, but BI makes it much easier. It helps plan, track, and evaluate promotions and campaigns so teams can see what works best. It goes beyond counting leads by showing return on investment (ROI).
Here’s a simple example:
| Campaign | Sales Generated | Cost | Profit (Sales - Cost) |
| Promotion A | $1,000 | $250 | $750 |
| Promotion B | $700 | $100 | $600 |
Even though Promotion A brought in more sales, Promotion B may be more efficient depending on the goal. With BI, teams can shift budget to the best-performing campaigns. By comparing expected vs. actual results, companies can market more wisely and spot new growth options.
Connecting sales and marketing BI tools can be hard, but the payoff is big. These practices help:
Start with clear goals: Decide what you want from shared sales and marketing data (better leads, higher revenue, better customer insight, etc.).
Work across teams: Since BI affects many people, sales and marketing should agree on how data is collected and used.
Pick tools that connect easily: Choose tools that link well with your CRM, marketing automation, and analytics tools.
Train users and support them: Give teams training, simple guides, and help over time so they can use BI well.
Treat integration as ongoing work: Collect feedback, review how tools are used, and adjust as business needs change.
Clean, organized data is the base for everything. Data quality and preparation should always be a top priority.
Picking the right BI tool for your sales pipeline can strongly affect team results and revenue. There are many choices, each with different features, integrations, and prices. Knowing what matters most helps you choose well.
Here are several well-known BI options used in sales and marketing:
Improvado: An AI-based marketing intelligence and analytics platform that connects data from 500+ sources, stores it in a central warehouse, and turns it into useful reports. It supports natural-language questions through an AI Agent and offers dashboard templates that work with tools like Tableau and Power BI. Pricing is custom.
Tableau: A major BI and visualization tool with 90+ integrations, including cloud services and SQL databases. Tableau Prep helps clean and combine data with drag-and-drop tools. It’s strong for visualization but does not include built-in marketing models, which can mean extra custom work. Pricing starts around $70 per user/month.
HubSpot Marketing Hub: An all-in-one inbound marketing tool for bringing in visitors, turning them into leads, and reviewing campaign results. Its reporting connects CRM data with marketing, sales, and service data. It includes pre-built dashboards and automation like lead scoring. It offers a free tier, with paid plans starting at $45 per month.
Salesforce Marketing Cloud Intelligence: A customizable set of tools that pulls data through APIs and file uploads and creates ongoing data feeds with metadata. It includes tools to unify, enrich, and validate data. As part of the Salesforce ecosystem, it can support a full customer view, with Einstein AI for predictions and suggestions. Salesforce CRM pricing starts at $25 per user/month.
Power BI: Microsoft’s analytics toolset for connecting to data sources, building dashboards, and sharing insights. DirectQuery supports real-time querying, and composite models support mixed data sources. Some users find data prep harder for very large or complex datasets. There is a free version, and Pro costs $9.99 per user/month.
The best BI tool depends on your situation. Key factors include:
Business size: Smaller teams may want simpler and cheaper tools; large companies often need more customizable setups.
Needs and goals: Decide if you care most about lead generation, forecasting, segmentation, or competitor research.
Integration: Check how well the tool connects with your CRM, marketing tools, and other data sources.
Budget: Compare the cost to expected ROI, including ongoing costs and scaling.
Data volume and difficulty: Make sure the tool can handle your data size and structure.
Customization: Confirm the tool can adapt as your needs change.
Features and connectors: Look for what you actually need (dashboards, forecasting, direct Salesforce connections, etc.).
Support: Good vendor support matters for setup, troubleshooting, and growth.
Adding BI to sales takes planning, execution, and ongoing work. It’s not something you set up once and forget. It grows over time as needs change.
A simple roadmap can help BI adoption go smoothly:
Define clear goals: Decide what you want (better leads, better forecasts, higher retention, etc.).
Review current data setup: List your data sources and how data is collected, stored, and reported today.
Pick the right tools: Choose tools that match your goals, budget, and systems.
Set data rules and quality standards: Make data accurate and consistent with validation and ongoing cleanup processes.
Build data pipelines and storage: Create ETL flows and load data into a warehouse or managed storage.
Create dashboards and reports: Build dashboards around key sales metrics that people can use quickly.
Train users and support them: Provide training and help so teams actually use the tools.
Support teamwork across departments: Help sales and marketing share insights and align actions.
Keep improving: Collect feedback, review tool usage, and update dashboards and models as needs change.
Even with clear benefits, BI projects often hit problems like these:
Data quality and integration: Different systems, mismatched formats, and missing data make integration harder and slower.
No clear plan: Without clear goals, teams may collect the wrong data or fail to use BI outputs.
User adoption and training: People may resist new tools or not know how to use them well without training.
Limited resources: BI work may need data engineers and analysts, which can be hard for smaller companies to fund.
Showing ROI: It can take time to prove value, especially early on.
Security and compliance: Privacy rules (GDPR, CCPA) add extra work in handling and managing data.
BI results depend on the data behind them. If the data is messy, the output will be wrong. Every BI effort starts with clean, well-organized data. That means fixing duplicates, wrong entries, conflicting formats, and missing fields before you start analysis.
For shared sales and marketing reporting, a unified CRM or analytics platform often works as a central hub for regular sync and reporting. It gives both teams real-time insight and supports better teamwork. Tools like Improvado can also help by automating integration across many sources, converting raw data into a ready-to-analyze format, and connecting with major visualization tools. This reduces manual work and makes the insight base more reliable.
In a business environment that changes quickly and brings new challenges all the time, reacting late is not enough. Companies that do well are proactive, fast, and guided by data. BI supports that by changing how sales teams compete and win.
BI helps sales teams move away from decisions based on opinions or stories and move toward decisions backed by real data. This makes it easier to understand market position, spot new trends, and respond faster. With BI insights, sales teams can find gaps in the market, see where internal processes need work, and spot innovation options competitors may miss.
A steady flow of useful insights also supports a proactive culture. Sales reps don’t just close deals-they use data to understand customers and predict needs. This improves productivity, helps reps hit targets, and raises profit.
Many BI tools also help teams work together by giving shared dashboards and shared insights. This improves alignment between sales and marketing, makes it easier to find and solve hard problems, and helps teams notice growth opportunities faster. With a shared view of performance, everything from lead generation to post-sale work can follow the same plan and goals.
Being data-driven helps a company compete strongly: quicker decisions, better use of resources, stronger customer relationships, and more consistent results. In today’s market, the ability to collect, analyze, and act on insights is a key part of long-term growth.
Business intelligence can feel confusing at first. Here are clear answers to common questions about how BI works in sales pipelines.
BI improves sales performance by giving salespeople useful insights they can act on. It reduces reliance on manual spreadsheets and scattered notes by giving quick access to key information. BI can track customer buying behavior, show past purchases, highlight what they have not bought, and help predict what they may buy next.
With this, sales teams can better understand customers and decide who to contact and when. That increases productivity and supports higher sales and profit. BI also gives real-time visibility, so teams can act right away rather than fixing problems after the fact. It can also flag issues early so teams can adjust their approach faster.
Sales analytics is the process of using data to improve sales results. It includes collecting and analyzing sales data to find insights across the sales cycle, such as customer trends, forecasting, lead conversion, territory planning, and pipeline tracking.
BI is what makes sales analytics easier to do at scale. Sales analytics is the process; BI tools provide the systems to collect, store, analyze, and visualize the data through dashboards and reports. BI gives the structure and tools needed to turn raw sales data into insights that improve performance.
If you want BI and machine learning features in the cloud, these platforms are common choices:
Amazon Web Services (AWS): Services like Amazon SageMaker (machine learning) and Amazon QuickSight (BI).
Microsoft Azure: Azure Machine Learning and Power BI for reporting and dashboards.
Google Cloud Platform (GCP): AI Platform and Looker for BI and data exploration.
The best choice depends on your current systems, your BI and ML needs, and which vendor setup fits your team best.
To measure BI ROI in sales, compare the business gains to the cost of setting up and running BI. You can track results in areas like:
Better forecasting: Less cost from overstock/understock and fewer missed sales from bad predictions.
Higher lead conversion: More converted leads and more revenue from improved qualification and follow-up.
Better territory and resource use: Savings and revenue gains from smarter coverage and better budget placement.
Higher sales productivity: More revenue per rep, shorter sales cycles, and more effective customer activity.
Better retention and lifetime value: More repeat buying and better upsell/cross-sell driven by customer insight.
More effective marketing spend: Better campaign ROI by shifting budget to what performs best.
Lower operational costs: Less manual reporting, fewer errors, and smoother processes.
Set baseline numbers before BI starts, then track the same KPIs after rollout. That makes it easier to show what BI is delivering financially and operationally.
 Send emails at scale