LIMITED SPOTS
All plans are 30% OFF for the first month! with the code WELCOME303
LIMITED SPOTS
All plans are 30% OFF for the first month! with the code WELCOME303

LIMITED SPOTS
All plans are 30% OFF for the first month! with the code WELCOME303

TL;DR / Key Takeaways
AR product visualization lets B2B buyers interact with 3D product models in their real environment before purchasing. For sales teams, the technology shortens decision cycles, reduces costly returns, and gives remote demos the impact of in-person meetings. The top recommendation for most mid-market B2B teams is to start with a focused pilot on your top 10 SKUs, measure engagement vs. close rate, and scale from there. Tools like Vizbl.com make deployment feasible without a dedicated development team.
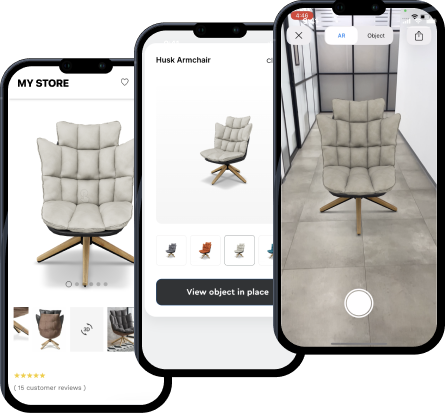
AR product visualization spent most of the last decade living inside B2C retail — furniture apps that let you place a sofa in your living room, try-on features for eyewear. B2B sales teams largely watched from the sidelines. That gap is closing fast, and the driving force is not the technology itself but buyer behavior.
According to Gartner, 80% of B2B sales interactions between buyers and sellers will occur in digital channels by 2025. When a procurement manager at a manufacturing company can no longer fly out to see a $200,000 machine in a showroom, the digital experience has to close the perception gap — and static PDFs or even video calls do not. AR product visualization fills that gap by letting buyers place a to-scale, interactive 3D model of your product inside their actual facility using a phone or tablet.
The "practical" part of this guide matters because most advice on AR assumes enterprise budgets or dedicated developer resources. The majority of B2B teams — especially in manufacturing, MedTech, logistics, and industrial equipment — operate with lean sales enablement stacks. This guide is written for those teams.
Understanding where AR product visualization adds leverage is more important than understanding how the technology works. The B2B sales cycle has four pressure points where spatial visualization changes outcomes.
1. Discovery / Initial Pitch — Buyers form first impressions during early-stage calls. A shareable AR link embedded in a follow-up email lets the prospect interact with your product before a formal demo is scheduled. This creates a tangible reason to respond.
2. Technical Evaluation — Procurement and engineering teams need to verify dimensional fit, clearance requirements, and interface compatibility. AR product visualization allows a buyer's team to walk through a 3D model in the context of their floor plan, answering spatial questions without a site visit.
3. Stakeholder Alignment — B2B deals involve an average of 6 to 10 decision-makers (Forrester, 2023). Visual content that non-technical stakeholders can interact with on a phone reduces the "translation problem" between the champion and the executive approver.
4. Post-Sale Onboarding — AR overlays showing assembly steps, maintenance access points, or configuration options reduce onboarding time and support tickets, which matters for account retention and renewal conversations.
Not all AR product visualization platforms are built for sales-team workflows. The table below compares the categories of tools available so you can match your team's technical capacity and deal complexity.
The practical choice for most B2B sales teams — those without a dedicated AR developer but with product engineers who can export CAD or GLTF files — is a standalone WebAR platform with no-code setup and shareable link delivery. Vizbl sits in this category, allowing sales reps to send a buyer an AR-ready product link without requiring an app download, which is the single biggest adoption barrier in field sales contexts.
The most common reason B2B AR product visualization pilots fail is scope. Teams try to digitize their entire product catalog before they have internal champions or success metrics. The 10-SKU method prevents this.
Identify the 10 products that (a) have the longest sales cycles, (b) generate the most pre-sale technical questions, or (c) have the highest return or cancellation rates due to specification mismatches. These are your strongest candidates for AR visualization ROI.
Work with your product engineering or design team to export clean GLTF or USDZ files for each SKU. If CAD files exist, most AR platforms can convert them. Asset quality directly affects buyer confidence — low-polygon or untextured models undermine the trust AR is supposed to build.
Pick one engagement metric (e.g., average AR session duration per prospect) and one outcome metric (e.g., close rate on deals where AR was used vs. not). Track both in your CRM from day one of the pilot.
Give each rep a clear script for introducing the AR link — "I'm sending you a link where you can see the [product name] at exact scale in your space" — and log every instance of AR use against the deal outcome.
If the AR-assisted pipeline shows a measurable difference in either cycle length or close rate, you have internal justification to expand. If it does not, the 10-SKU scope means you have not over-invested.
AR product visualization is not speculative technology. The supporting data across analogous B2B and high-consideration B2C contexts is consistent enough to inform B2B sales strategy today.
Shopify published data showing that products with 3D and AR content have a 94% higher conversion rate than products with standard 2D images. While this is an e-commerce data set, the underlying mechanism — reducing buyer uncertainty through spatial familiarity — maps directly to B2B procurement. Industrial buyers face the same uncertainty a consumer does when they cannot physically inspect a product.
PTC, one of the enterprise AR leaders in manufacturing, reported that AR-assisted maintenance and sales demonstrations reduced the number of required in-person visits by up to 40% in documented customer deployments. For B2B sales teams managing large territories, that reduction in travel directly improves capacity per rep.
A 2022 study published in the Journal of Retailing found that AR product visualization reduces cognitive load during purchase decisions — meaning buyers reach confidence faster because they have to mentally model fewer unknowns. In complex B2B deals, cognitive overload is a documented cause of stalled decisions. AR does not just improve the experience; it mechanically reduces the friction that causes deals to go dark.
FAQ About AR Product Visualization for B2B Sales
Does AR product visualization require buyers to download an app?
Not with modern WebAR platforms. Current WebAR technology runs directly in a mobile browser — Safari on iOS and Chrome on Android both support AR viewing natively. Buyers receive a link and tap to launch the experience without any app installation, which significantly reduces friction in enterprise selling environments where device management policies restrict app installs.
How much does it cost to get started with AR product visualization?
Entry-level WebAR platforms designed for sales teams typically range from $100 to $500 per month depending on the number of users and 3D models hosted. Custom enterprise builds with CAD integration and CRM connectivity are project-priced and can run $20,000 to $100,000+. For most B2B teams, starting with a no-code WebAR tool and upgrading based on pilot results is the most cost-effective path.
What 3D file formats do AR visualization platforms typically support?
The most common formats are GLTF/GLB (cross-platform), USDZ (optimized for Apple devices and required for iOS AR Quick Look), and OBJ with texture maps. Most CAD tools — SolidWorks, AutoCAD, Fusion 360 — can export to these formats either natively or via conversion. Confirm format compatibility with your chosen platform before beginning asset preparation.
Can AR product visualization integrate with CRM and sales platforms?
Some AR platforms offer native integrations with Salesforce and HubSpot, allowing reps to log AR engagement events directly to contact or opportunity records. Others provide webhook or API access for custom integration. If CRM tracking is a priority for your pilot metrics, confirm integration capability before committing to a platform.
How do you handle products that are highly configurable, like industrial machinery with multiple variants?
Configurable AR experiences — where buyers can change color, module layout, or component options inside the AR view — are possible but require more investment in 3D asset preparation and platform capability. The practical approach for configurable products is to start with your most common configuration as a static AR model, gather buyer feedback, and invest in configurator functionality once you have validated the base use case.
Is AR product visualization effective for intangible or software-heavy B2B products?
AR product visualization is most impactful for products with a physical form factor — machinery, hardware, infrastructure, medical devices, vehicles, and similar categories. For software-heavy or service-oriented offerings, interactive 3D visualization of physical components (e.g., server infrastructure, IoT devices, or integration hardware) still applies, but the ROI case is weaker than in product-first categories.
What is the typical timeline for launching a B2B AR product visualization pilot?
Using a no-code WebAR platform with existing or easily exportable 3D assets, most teams can run their first AR-enabled sales demo within two to four weeks of starting. The main variable is 3D asset quality and availability — if your team needs to build models from scratch, plan for four to eight additional weeks. If you have clean CAD files, the timeline compresses significantly.
Conclusion: Start Small, Measure Relentlessly, Scale What Works
AR product visualization is no longer a future-state capability. It is available, affordable, and proven — the barrier is internal adoption, not technology access. The B2B sales teams that are pulling ahead are not the ones with the biggest AR budgets. They are the ones that identified their three highest-friction deal stages, introduced spatial visualization at those moments, and measured the result.
Your practical next step: identify your top 10 highest-consideration SKUs, export one 3D asset, and share it with a buyer before your next follow-up call. You will learn more from that one interaction than from six months of planning.
If you are evaluating platforms to support that pilot, explore what WebAR tools built for sales teams — like Vizbl — offer in terms of no-code setup and shareable link delivery. The technology barrier is lower than you think. The competitive advantage is available right now.
 Send emails at scale